No dental practice is the same, so why do so many professionals compare their practice to the one down the street?
Considering all the decisions that go into owning and operating a practice, we all know there isn’t necessarily a “correct way” to do things. But, it’s hard not to wonder how your practice compares to others down the road, or even across the nation. If done correctly, comparison to similar practices can offer insight and optimization, as long as one is asking the right questions and looking at the hard numbers.
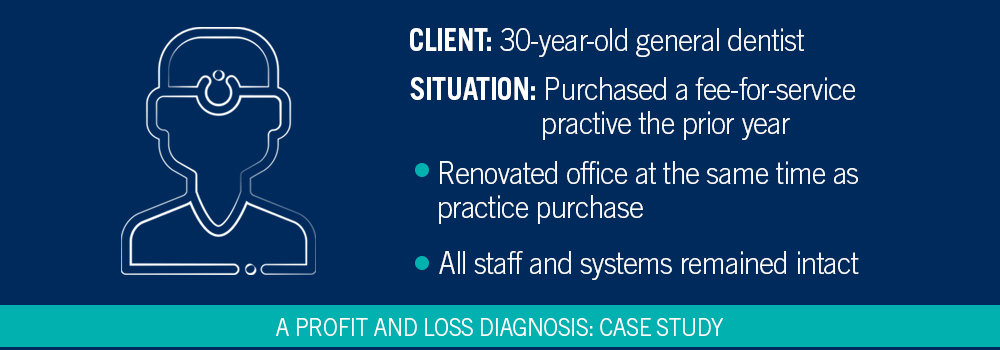
One particular client comes to mind here. He came in a year after buying a practice and felt that money was way too tight for his situation.

At CWA, the first meeting we have with a client takes a deep dive into their situation. It starts with getting the numbers and evaluating how they are performing, but also building an understanding of the practice by discussing the dentist’s philosophy, hygiene protocol, number of new patients, types of procedures performed, fees, etc. In this case, we started with examining the client’s fees and made recommendations to increase certain fees that were abnormally low for their area.
The next thing we do is we break up a client’s profit and loss statement into two separate categories:
– Direct expenses: Costs that vary based on production. For example, as you see more patients, these are costs that will increase – like lab fees, supplies, hygiene/chairside salaries.
– Fixed expenses: These are costs that are fixed to your business, and are constant regardless the quantity of goods or services produced. For example, costs such as your building rent, insurance, pension or subscriptions are standard month to month, regardless of your production. Often referred to as overhead.
This allows us to see every client’s profit and loss in the same format and we can “diagnose” when an expense item is outside the norm.
This young dentist inherited the good and bad with the practice. The existing staff was “good,” but the percentage of staff salaries was high at 31% of collections. As we’ve seen in our How Does Your Dental Practice Compare? Report, the typical CWA client sees staff salaries run 20-24% of collections.
Are you an orthodontist or pediatric dentist? Our in-depth Orthodontic Practice Comparison Report and Pediatric Practice Comparison Report will also help you compare to others across the nation.
Another area that was outside the norm was dental supplies which were at 9%, and typically run 6-7%. The other direct expenses were in-line with where they should be.
Next, we began to analyze the fixed expenses and compare those to industry standards. Fixed Costs, by their nature, typically do not change on a monthly basis. A few items that we quickly identified as high: he was overpaying for his accounting fees which were $1,300 per month, merchant processing fees were too high at about $600 per month, and staff medical insurance was being paid at 100% of the employer’s cost which was about $3,500 per month.
Then we looked at the bigger picture: His net profit was 23%, or about $16,000 per month. The amount of debt as a result of the recent practice purchase, and the terms of the loan, meant he was paying $16,000 per month on his note. So after paying his debt note he didn’t have much, if any, money left for lifestyle. Not to mention, we recommend 50 percent of your income to be attributed to lifestyle expenses.
As a result, he was actually operating in the red about $9,000 per month because that was the amount he needed to live on.
IDENTIFYING THE SAVINGS OPPORTUNITIES
With the breakdown of the expenses and the layout of his practice, we were able to compare his situation to others. Our strategic suggestions made small tweaks in his practice that collectively added up to quite a bit of money.
We got in pretty deep, from staff salaries to dental supplies and merchant processors, combining his monthly savings to $4,500 a month on direct costs. But, he wasn’t out of the woods yet. We had him refinance his debt, which increased cash flow. Finally, raising his fees to meet industry standard for the area.
All of these things combined reduced his expenses by $7,500 a month, his break-even point and initial goal.
GOING BEYOND THE NUMBERS
We covered a lot of ground in our first meeting. To take a closer look at issues, or savings opportunities, he was advised to hire a dental consultant to review his practice and give him additional guidance.
This is always a good idea, as numbers can alert us as a financial team to large issues, but we don’t get to observe and develop that deep understanding of how a practice like his operates.
In the 12 months following his meeting with the consultant, his practice collections increased $18,000 per month and after paying his direct expenses of $3,000 left him with $15,000 of that visible to the bottom line. What an amazing impact.
This client continued to make additional small changes over the years, such as changing his lab, restructuring the hygiene department, changes at the front desk like automated patient reminders, insurance billings, additional Doctor CE, and more. He’s continually striving for improvement.
NOT STOPPING THERE
Since this clients’ initial visit in 2004, his profitability has gone from 23% or $16,000 a month to 50% profit or $66,000 a month! Yes, he is still a 1 doctor practice, and his practice is now debt free.
Even with all this success, this client comes to our office every year and wants to know how he is doing compared to other CWA clients—and the process hasn’t changed. We look at each itemized line and compare that to others nationwide in our How Does Your Dental Practice Compare? Report.
Interested in seeing how you compare? Download our report by clicking here.


